This action will delete this post on this instance and on all federated instances, and it cannot be undone. Are you certain you want to delete this post?

Todd Sundsted posted Nov 26, 2022
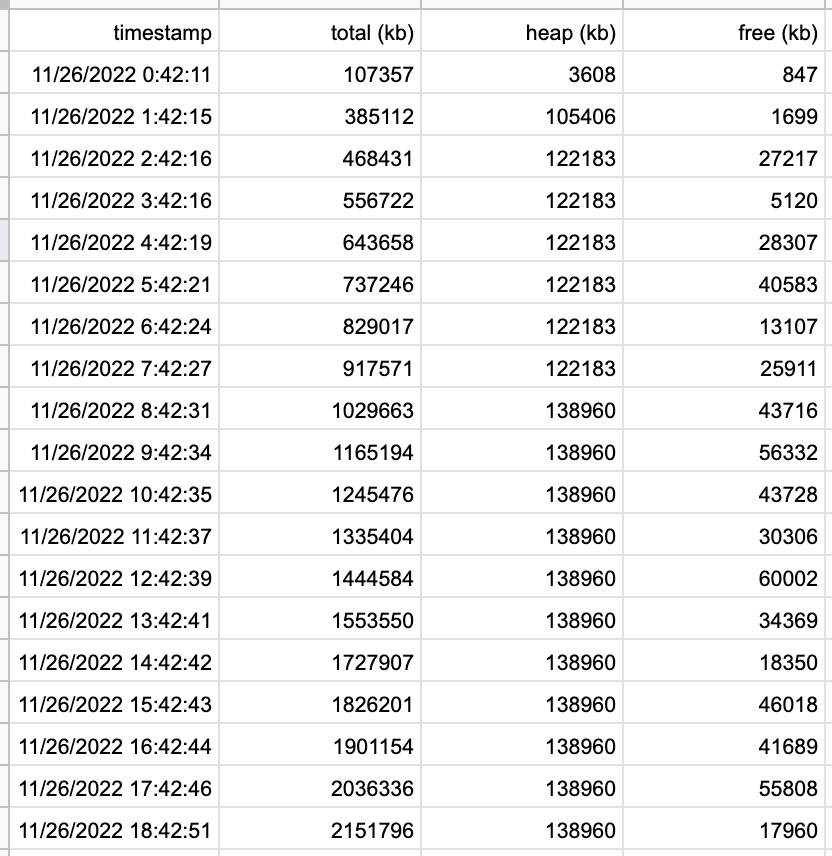
i added some in-process data collection to ktistec in order to better understand how it uses memory.
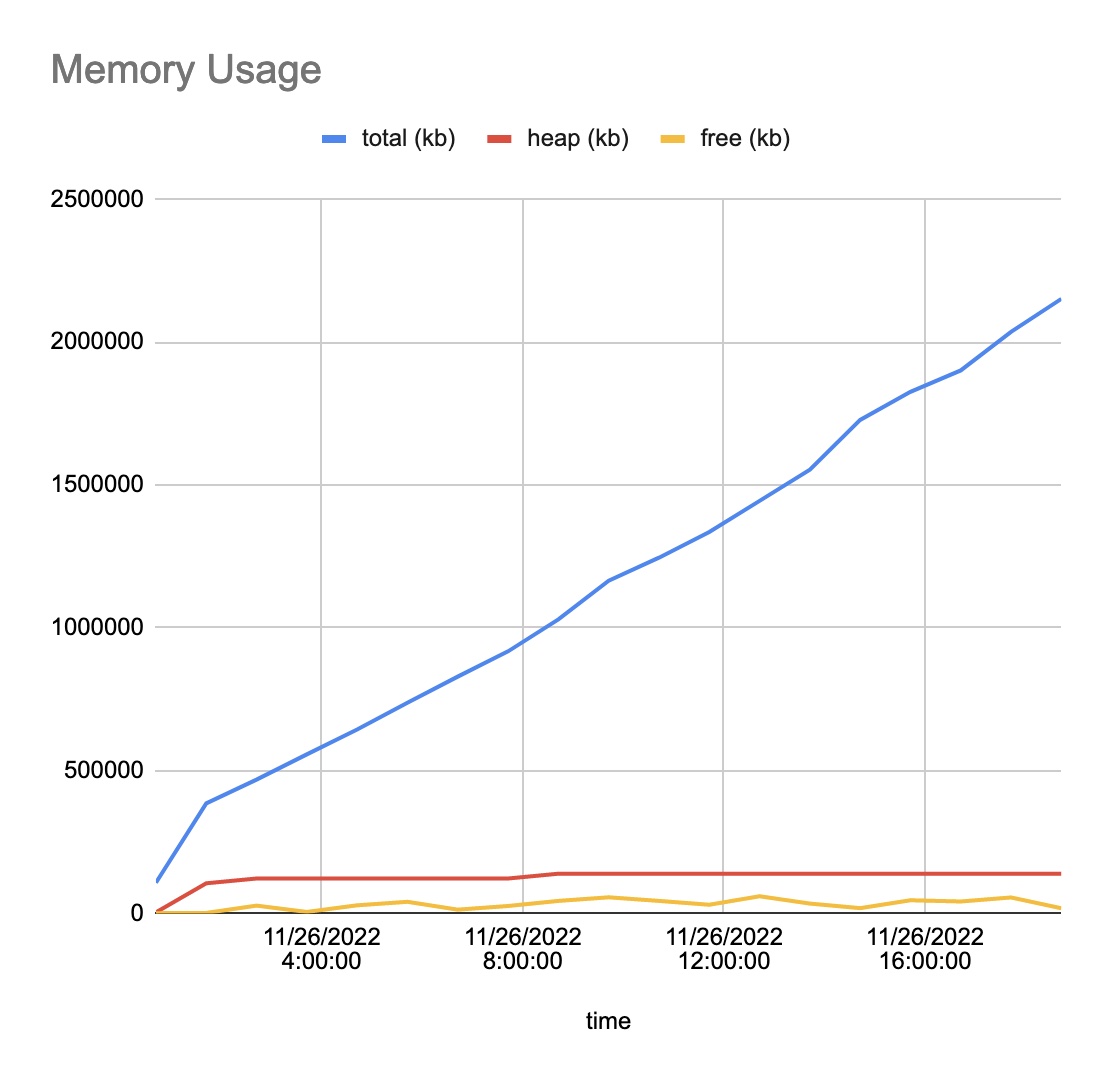
the chart shows the accumulated total requested memory (blue) over time. as expected, it grows monotonically and almost linearly. in theory, i guess, if i posted something engaging, you'd see the effect of the engagement (likes, shares, follows, etc. etc. etc.) on memory usage. in any case, the heap (red) remains flat.
i think it would be great to have this chart on the metrics page. when time permits, i'll add it. in the meantime, if you're running a (very) recent build, you're collecting data.